November 15. 2010
Perrin S. Meyer
Program for the Human Environment
The Rockefeller University
1230 York Ave, Box 234
New York, NY, 10065
Phone: (212) 327-7842, Fax: (212) 327-7519
email: perrinmeyer _at_ yahoo _dot_ com
http://phe.rockefeller.edu/perrin/
Dear Sir:
A friend directed me to the excellent article Human Population Dynamics Revisited with the Logistic Model: How Much Can Be Modeled and Predicted? Cesare Marchetti, Perrin S. Meyer and Jesse H. Ausubel, Program for the Human Environment, The Rockefeller University Technological Forecasting and Social Change 52, 1-30 (1996). I read it with great interest.
My own interest is in fertility, and this was the primary concern of the article. The message I took home was that birth rates can be modeled with exquisite accuracy but are about impossible to predict. The lines are smooth and shapely, but it is never clear what the line is going to do next. This of course suggests an underlying mechanism that is very powerful and very simple. You also notice puzzling consistencies. For instance the ages at which a woman has children tend to center on 28, be fertility high or low. So when there is going to be a change in birth rate it is anticipated by a cohort of women starting childbearing earlier or later in their lives even though the overall birth rate will not be changing for years. How could they know? Again, a hitherto unknown, or unknown in 1996, mechanism is hinted at.
I have often been puzzled by the fact that kinship is not mentioned when people talk about fertility. I suppose it is widely known that kinship correlates with fertility, but it doesn’t come up for mention. Neither does inbreeding depression. A moderately inbred population should have a low birth rate without recourse to other means. As the inbreeding is released, there ought to be a bit of a baby boom. I suppose modern dogma forbids birth control by inbreeding, but is hard to believe it never happened in the past.
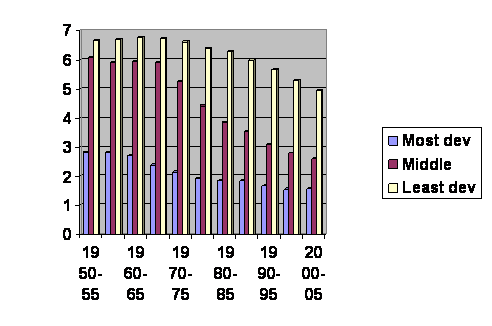
Let me drop in a couple of graphs before I get to the point. This is a graph of the world’s population I put together from UN numbers. Here are the UN numbers for the past 50 years. It is birth rates broken down by developed, less developed and least developed regions.

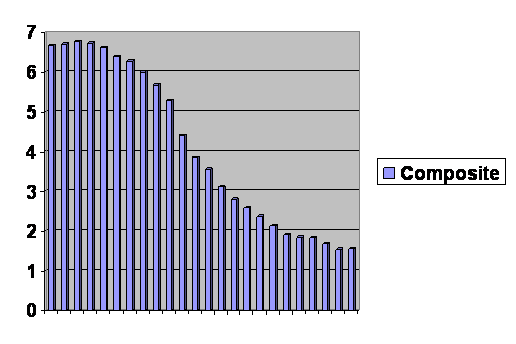
The vertical axis is the average number of children born per woman. The horizontal axis gives the dates of the surveys. The lines move serenely up and down with no immediate surprises. But if we edit the graph, following one region until it overlaps the next and then skipping to when that region had the same birth rate, we see this.

It’s all the same curve. Different populations are just at different points along the line. I thought you might like that.
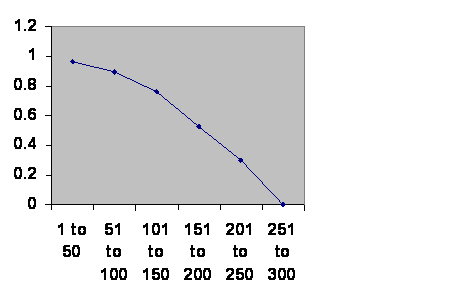
Here’s another. This is the experience of southern Mesopotamia throughout history. Mesopotamia.

Information taken from R. H. Carling THE WORLD HISTORY CHART International Timeline Inc. Vienna, VA 1985. The experience of Southern Mesopotamia. The vertical axis is The chance of an empire of any age continuing to rule locally for another 50 years. The horizontal axis is the ages of the empires. I broke the Ottoman Empire into two, because their Janissary elite came from two different sources during the early and late empire.
Again you can see the smooth progression. It seems that from the biggest view, changes are not so unpredictable after all.
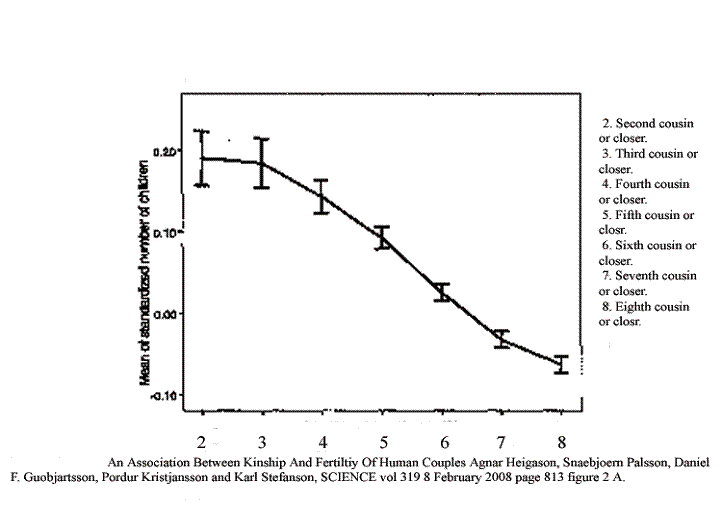
Now to get to the point, in the past few years our understanding of the relationship between kinship and fertility has increased a lot. There are three key references that show this. One is a compilation of field studies of animals. On the Regulation of Populations of Mammals, Birds, Fish, and Insects, Richard M. Sibly et al. SCIENCE vol. 309 no. 5734 JULY 22, 2005 page 607 – 610 The second is a study from Iceland.
 An Association between Kinship and Fertility of Human Couples Agnar Helgason et al. SCIENCE vol. 329 no. 5864 February 8, 2008 page 813 – 816
And the third is in two parts and comes from Denmark. Rodrigo Labouriau et al. Human Fertility Increases with Marital Radius, GENETICS vol. 178 no. 1 January 2008 page 601 - 603, and Comment on “An Association between Kinship and Fertility of Human Couples,” Rodrigo Labouriau et al. SCIENCE vol. 322 no. 5908 12 December 2008 page 1634 – 1635
I won’t burden you with the graphs of the animals or the Danes. They are just like the Icelanders.
I have hoarded up what information I can put together on my website nobabies.net where I shall also post this letter.
In broad stroke, it is clear that a large randomly mating population will eventually shrink with no obvious bottom. This bodes ill for any civilization.
There is a lot more evidence. Possibly the easiest way to get more of it is to look at the Albquerque poster that is copied on the website.
I believe this is your unseen mechanism. Since at least the Iceland study is sufficiently quantitative to permit calculations, it should be possible to put it all together, but it will require a master such as you. If I can be of any assistance, do let me know.
Do you have a reference for the correlation between storks arriving in Germany and the birth rate? It’s quite charming.
Sincerely,
M. Linton Herbert MD
There have 6,994 blank visitors counted so far.
Home page.


 An Association between Kinship and Fertility of Human Couples Agnar Helgason et al. SCIENCE vol. 329 no. 5864 February 8, 2008 page 813 – 816